
What are the best selling products for a manufacturer? Who's buying a specific product?
This type of information can be invaluable. Rather than go to the manufacturer and ask for the information, run a report in MRSware to find the answer.
As usual, in MRSware, there's more than one way to find out this information.
Here's how to run a report showing top selling products by manufacturer.
(In the example, we're looking at Toys and Games Co)
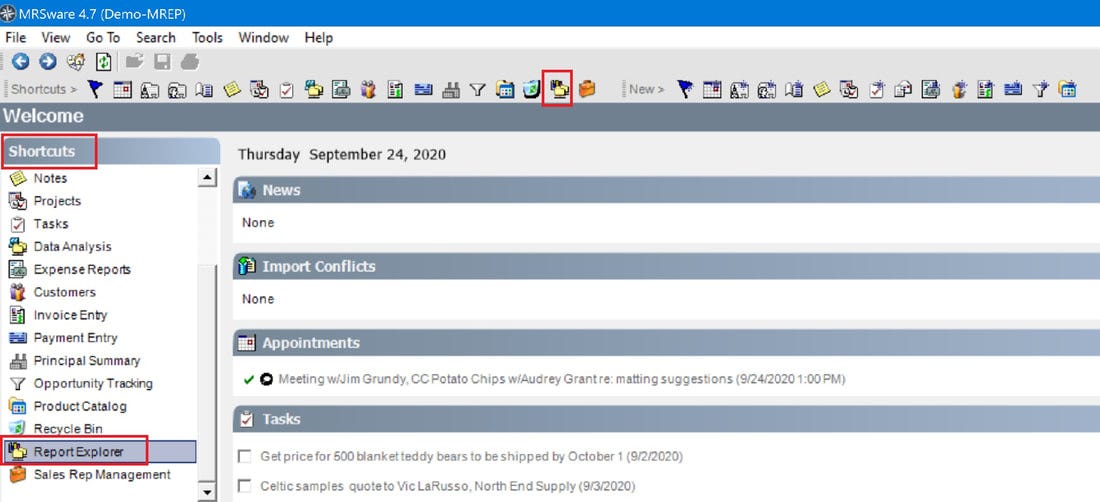
1. Click on "Report Explorer" in the Shortcuts panel
OR
1. Click on the "Report Explorer" icon on the Shortcuts tool bar
Once Report Explorer opens,
2. Scroll down to find the Product Reports.

3. Double-click on "Product Sales (top 20)"

Once the Report Prompt opens,
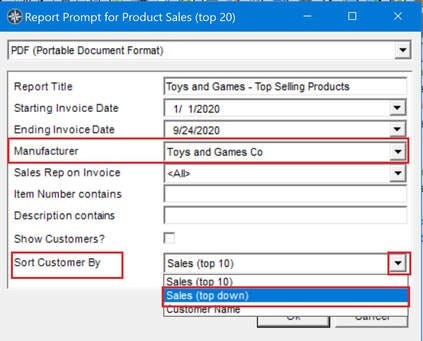
4. Make your selections
In the example to the right:
- we named the Report Title
- left the Dates as the default
- chose the Manufacturer - Toys & Games
- left the Sales Rep as the default
- chose Sales (top down) as the Sort
Once all your selections have been made:
5. Click "Ok"
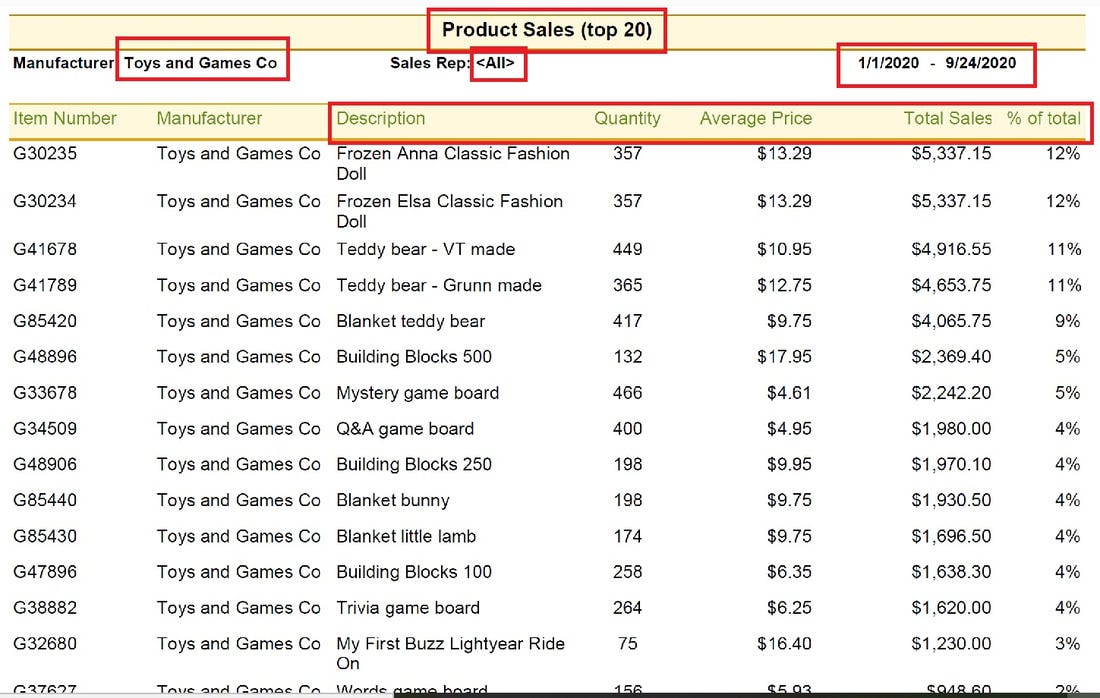
The Report opens showing:
Toys and Games Co, Top Selling Products YTD, by dollar sales, by quantity, and by percentage of the total sales.
To look at a single product's sales, by Customer
Repeat steps 1 and 2
3. Double click on "Product Customers"

Once the Report Prompt opens,
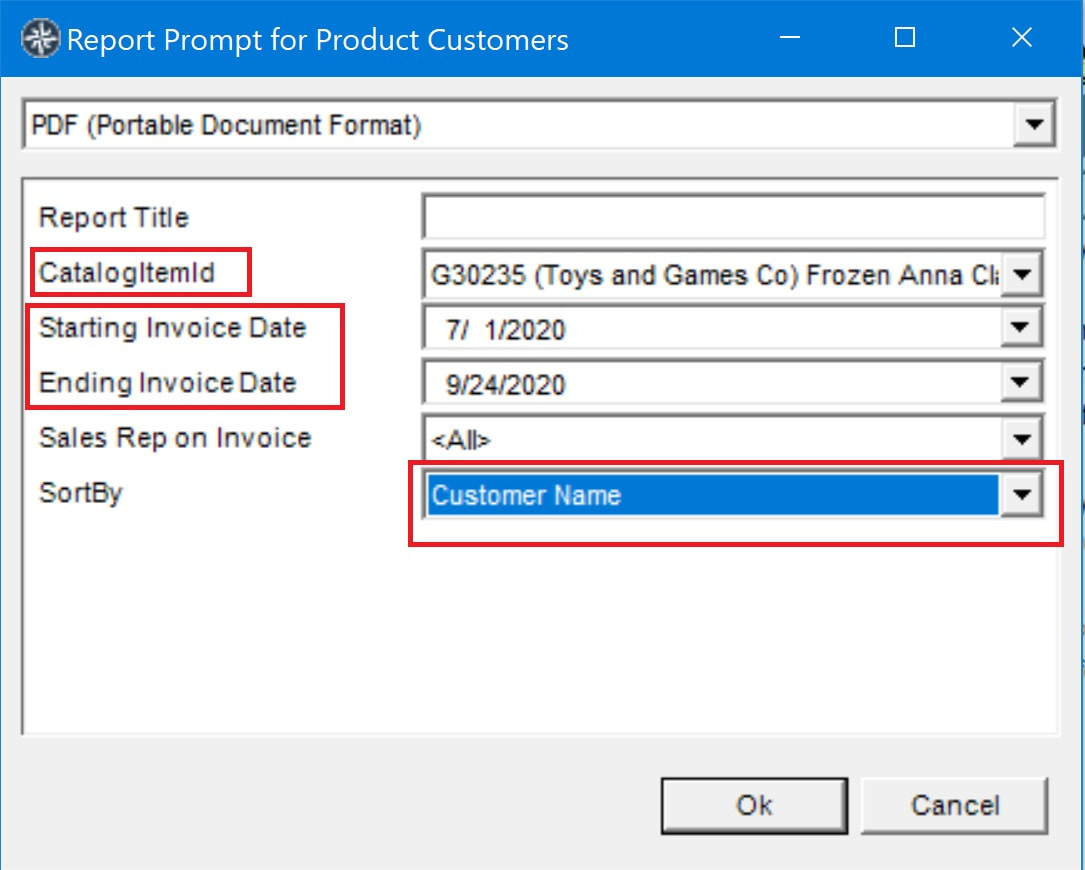
4. Make your selections
In the example to the right:
- we selected a catalog item number
- we selected a Starting Date of 7/1/2020 and
left the Ending Date as the default
- chose the Manufacturer - Toys & Games
- left the Sales Rep as the default
- chose Customer Name as the Sort
Once all your selections have been made:
5. Click "Ok"
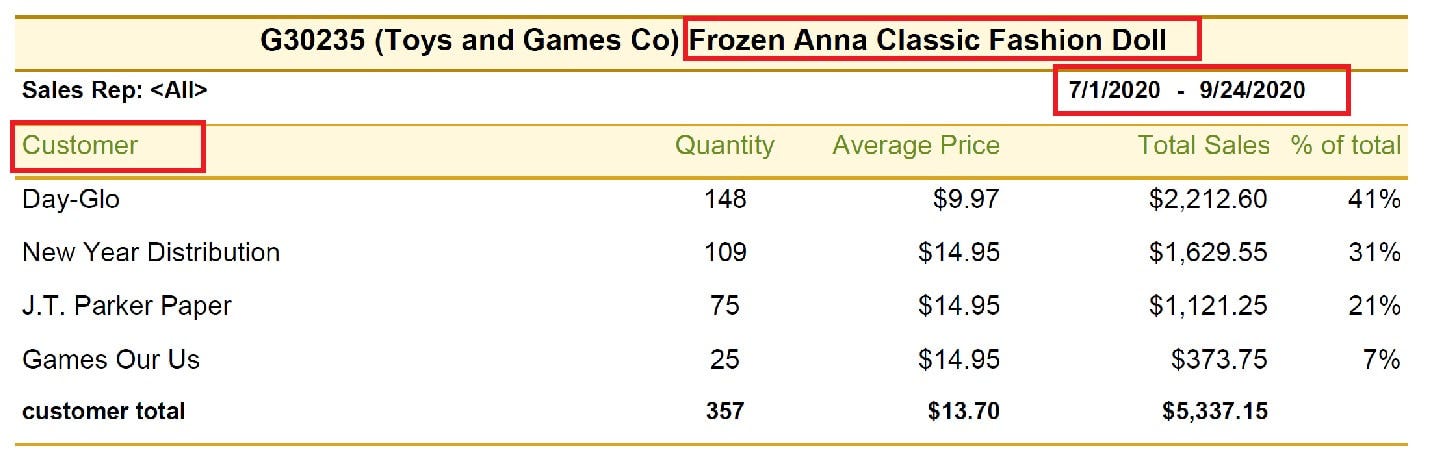
Here's how to use Data Analysis to show the top selling products by manufacturer.
(In the example, we're looking at Solo Manufacturing Group)
1. Click on "Data Analysis" in the Shortcuts panel
OR
1. Click on the "Data Analysis" icon on the Shortcuts tool bar
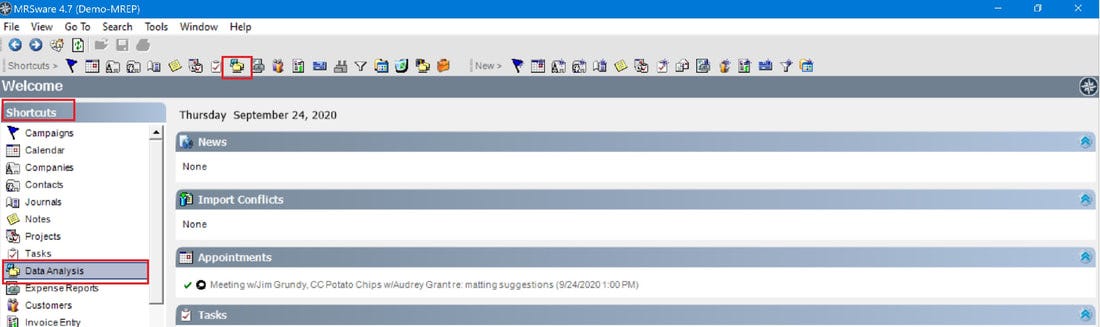
Once Data Analysis opens,
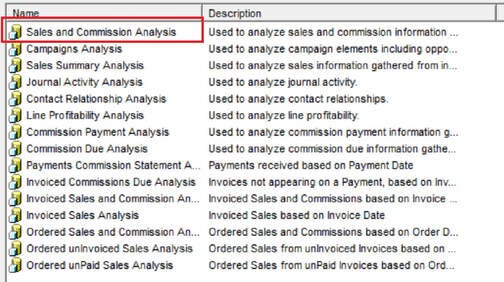
2. Double click on an Analysis Cube (in the example we've selected Sales and Commission Analysis"
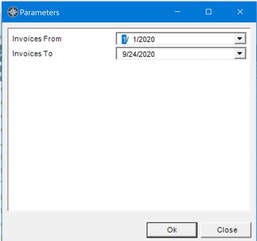
When the Sales and Commission Parameters opens,
3. Select your From and To Dates
When the Sales and Commission opens,
4. Move the dimensions so as to appear in the order you want to view the data.
The dimensions are on the left - the default when analysis cube opens is as seen in the screenshot below:
- Customer
- Principal
- Product
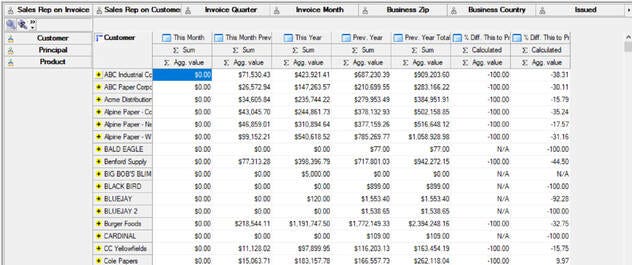
To move the dimensions, drag them to the location you want to view your data.
First we drag Principal above Customer. Then we drag Product above Customer.
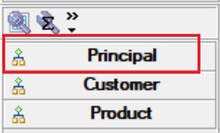
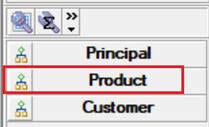
Next we want to filter the data.
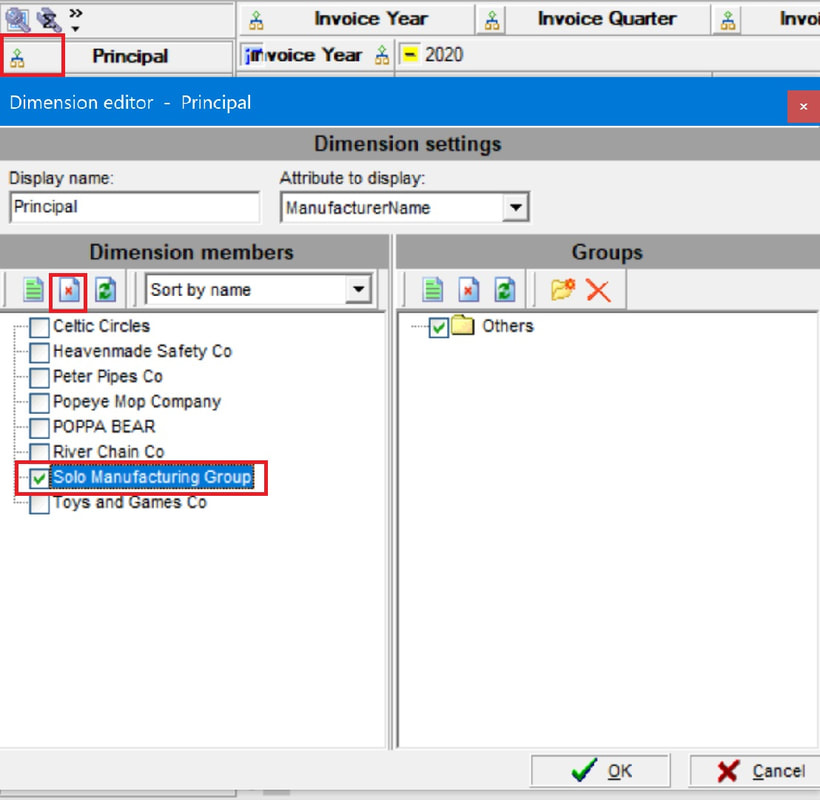
To filter the Principal so we only see Solo Manufacturing Group's products,
1. Click on the tree to the left of Principal
2. Click on the red x under Dimension members. This will remove the checkmarks next to all the Principals listed.
3. Click the box next to Solo Manufacturing Group to select the Principal.
8. Click "Ok"
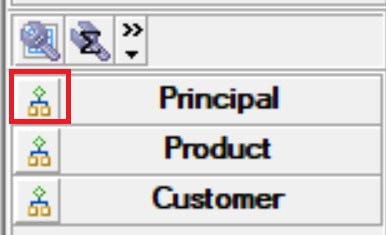
Now we want to filter the Summary columns.
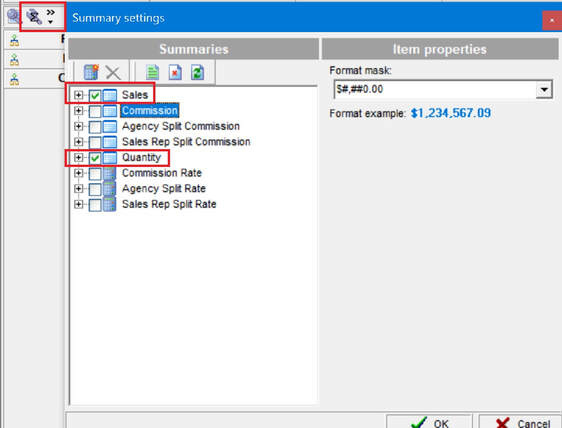
To filter the Summary columns,
1. Click on the icon above the Dimensions with the Greek E on it.
When the Summary Settings dialog opens,
2. Uncheck the boxes next to Commission, Agency Split Commission, Sales Rep Split Commission
3. Check the box next to Quantity
4. Click "Ok"
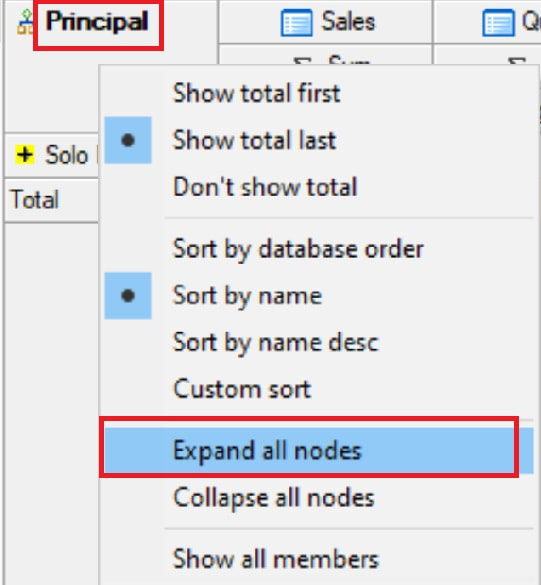
Next "Expand all nodes", to view each dimension in a column.
Right-click on the "Principal" column and select "Expand all nodes"
Then, right-click on "Products" column and select "Expand all nodes"
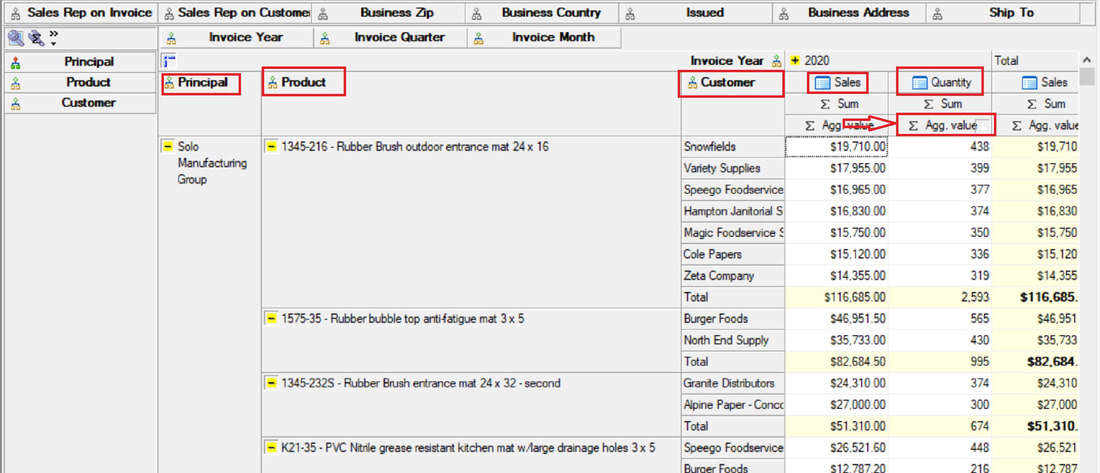
Finally, sort the Quantity column, Top down, by double clicking on the "E Agg. value" cell (see arrow below)
The final result shows you the most product units sold and the customers who purchased that product.
In the example below, Solo Manufacturing Group, sold 2593 each, product # 1345-216- Rubber Brush outdoor entrance mat 24 x 16, so far in 2020. Snowfields was the customer who purchased 438 each of this mat, more than any other customer to the tune of $19,710.00. Variety Supplies was next in line for the most sold, and so on down the list.
To view a video of how this works in Data Analysis, click on Data Analysis: Product Details.