
Data Analysis is my preferred choice for reporting in MRSware. With Data Analysis you can manipulate the table with the data by sorting, filtering, using pre-set calculations, and even adding custom calculations to the columns.
Once you have taken the time to get your report exactly the way you want it, you can save the view so next time you open Data Analysis, you don't have to move the various dimensions around to get it back to your preferred view.
Here's an example of how to save your Data Analysis view:
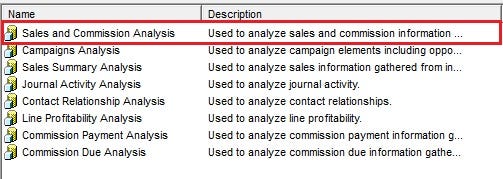
1. Click on Sales and Commission Analysis
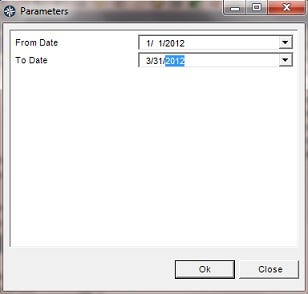
2. When the Parameters dialog opens select your date range. In this instance I selected:
From Date: 1/1/2012
To Date: 3/31/2012
Click Ok
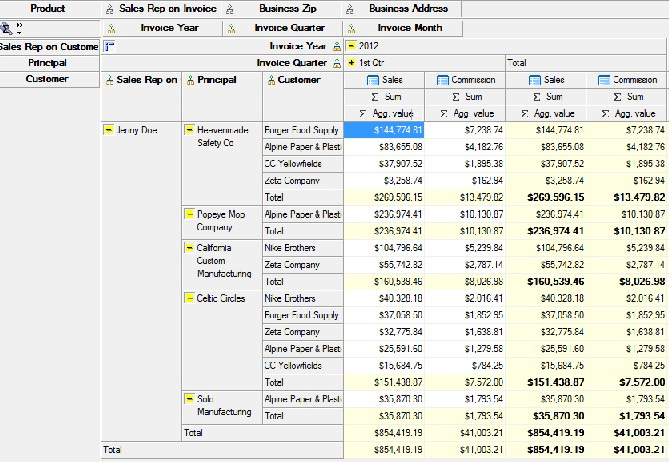
3. Set up your view in the Sales & Commission cube
In the example below we selected:
Sales Rep on Customer, Principal, Customer and then filtered to show only Jenny Doe's data for the 1st quarter.
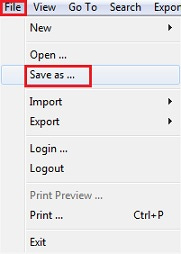
4. Click on File -> Save as
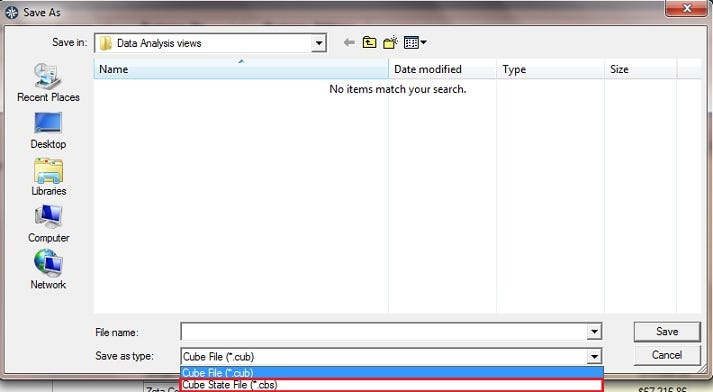
5. When the Save as window opens click on Save as type field (at the bottom of the window) and select State File cube (*cbs.)
6. Type the name of the file into the File name field and click Save
In the example I chose "DA view - Sales Rep Principal Customer"
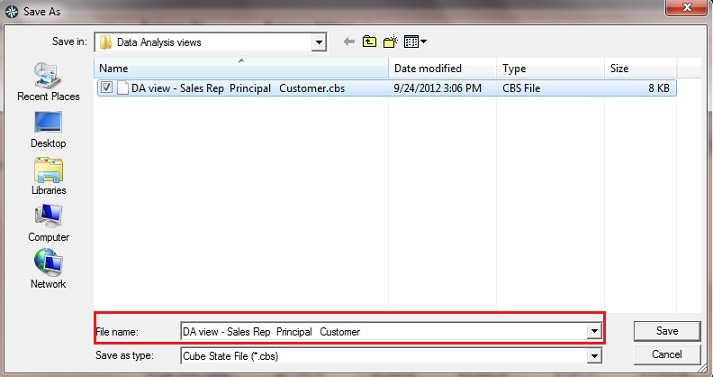
Now you've saved your view. Anytime you want to see your data this particular way, you can re-open the view with new dates.
Here's an example of how to re-open your saved Data Analysis view:
1. Click on Sales and Commission Analysis
2. When the Parameters dialog opens select your date range. In this instance I selected new dates in order to see all data for the 1st two quarters of the year:
From Date: 1/1/2012
To Date: 6/30/2012
Click Ok
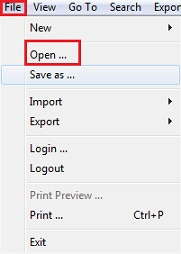
3. When the Sales and Commission Cube opens, click on File -> Open
4. Your window opens showing the folder where you saved your Data Analysis views
Click on State Cube File in the Files of Type field
Select your view - in the example I selected "DA view - Sales Rep Principal Customer"
Click Open
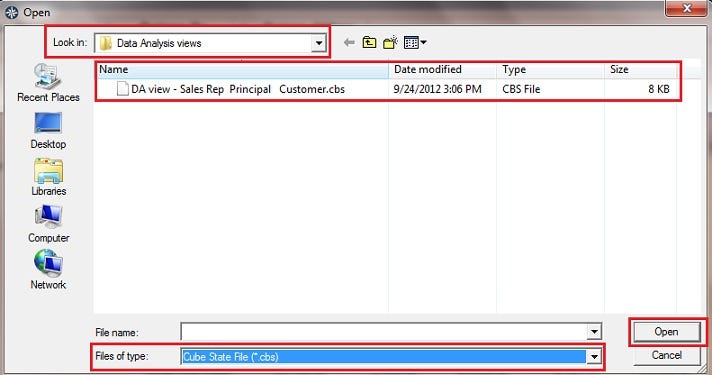
The Sales and Commission Data Analysis cube you opened will now show the saved view with the new sales and commission numbers reflecting your new dates set in the Parameters dialog.
You can save as many different views you like and re-open them when needed.