
Our customers often ask how they can find out what each line represents, as a percentage of their total sales or total commissions. For instance, the agency represents 10 lines. Which lines are the most important - sales wise and commission wise?
In the old days we had to set up an Excel file and enter the total sales and the total commissions for each line and then sort by sales or by commissions to find out which lines were the largest. You would have to enter a formula into Excel in order to find out the actual percentage of total sales or total commissions each line represented.
Now all you have to do is use MRSware's Data Analysis "Sales and Commission Analysis" to get this information. If you have entered your sales and commissions into MRSware the analysis cube will automatically formulate the information for you. All you have to do is click a couple of buttons to see the results.
In the old days we had to set up an Excel file and enter the total sales and the total commissions for each line and then sort by sales or by commissions to find out which lines were the largest. You would have to enter a formula into Excel in order to find out the actual percentage of total sales or total commissions each line represented.
Now all you have to do is use MRSware's Data Analysis "Sales and Commission Analysis" to get this information. If you have entered your sales and commissions into MRSware the analysis cube will automatically formulate the information for you. All you have to do is click a couple of buttons to see the results.
Here's how:
| 1 - Click on "Data Analysis" in the Shortcuts panel or the "Data Analysis" icon on the Shortcuts Tool bar |  |
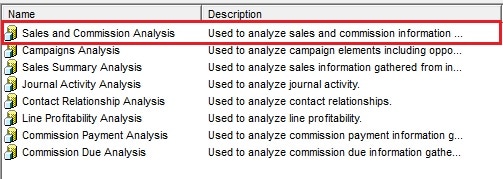 | 2 - Select the "Sales and Commission Analysis" |
| 3 - Select the dates you want to look at in the Parameters dialog In the example we selected the first quarter of 2012. | 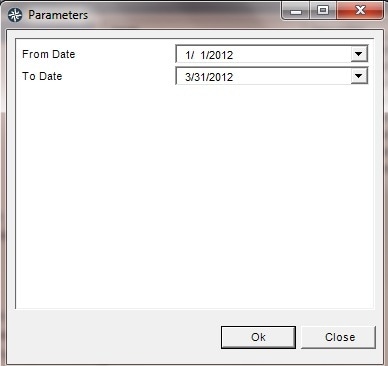 |
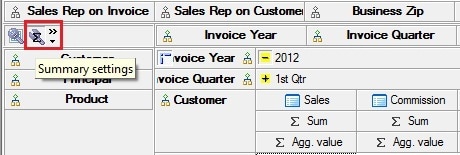 | 4 - Click on "Summary Settings" |
| 5 - Check or Uncheck the boxes you want to include in the analysis In the example we unchecked Agency Split Commission & Sales Rep Split Commission. 6 - When done, click "Ok" | 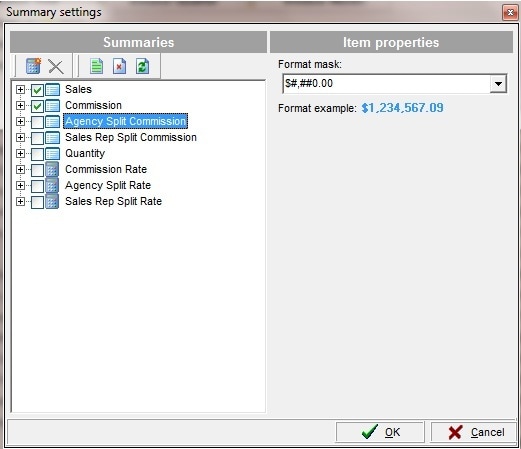 |
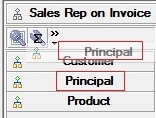 | 7 - Hold down the left mouse button, click on "Principal", and drag "Principal" above "Customer". Release the left mouse button to place "Principal" at the top of the list. The list should read (top to bottom) "Principal", "Customer", "Product". |
| 8 - To view the Principals with the most sales top down, click on "Agg. value" under the Sales column | 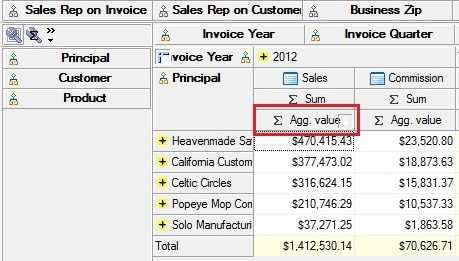 |
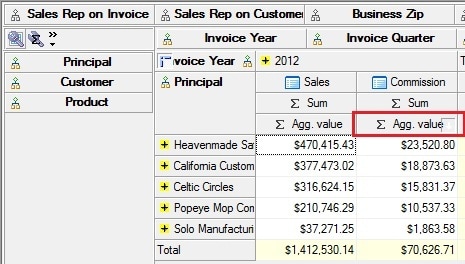 | 9 - To view the Principals with the most commissions top down, click on "Agg. value" under the Commission column |
| 10 - To view what percentage each Principal is of total sales, right-click on "Sum" under the Sales column and select "% Col". | 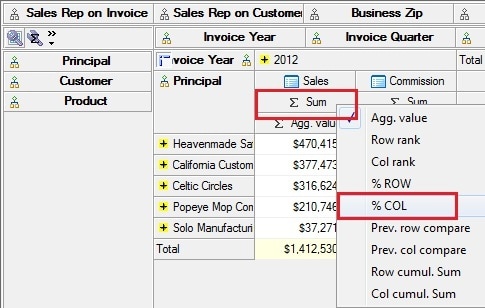 |
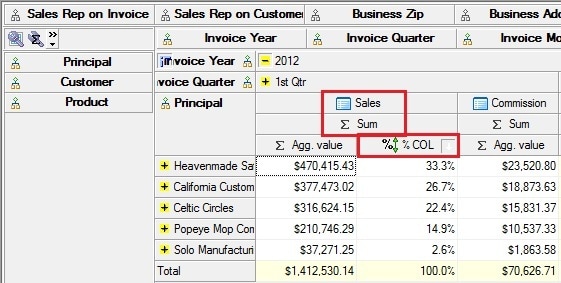 | To view the results top down, double-click "% COL" - Heavenmade has the largest % of total sales, followed by California Custom |
| 11 - To view what percentage each Principal is of total commission, right-click on "Sum" under the Commission column and select "% COL" | 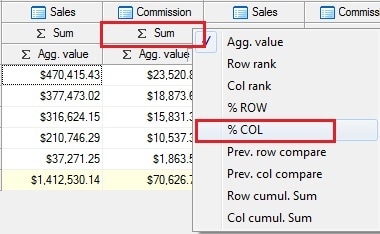 |
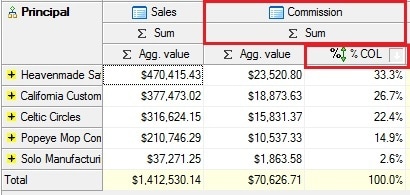 | To view the results top down, double-click "% COL" - Heavenmade has the largest % of total commissions followed by California Custom |
It's always a good idea to check % COL for both Sales and Commission in the analysis because a Principal may not have the same ranking in sales as they do in commission.
In the examples used above - 1st quarter of 2012 - the Principals have the same ranking for sales and commissions. However, this may not always be the case.
For example, if a line that has a smaller sales dollar volume pays a higher commission rate, then that line may have a larger commission dollar volume than another line that has a larger sales dollar volume but pays a lower commission rate.