Part 9: Reporting, Data Analysis & Business Intelligence
Data Analysis Pivot Grid Engine
The Data Analysis engine in MRSware Desktop is a multi-dimensional pivot grid allowing instant slicing and dicing of agency financial performance across any combination of fields.
The 5 Magical Columns
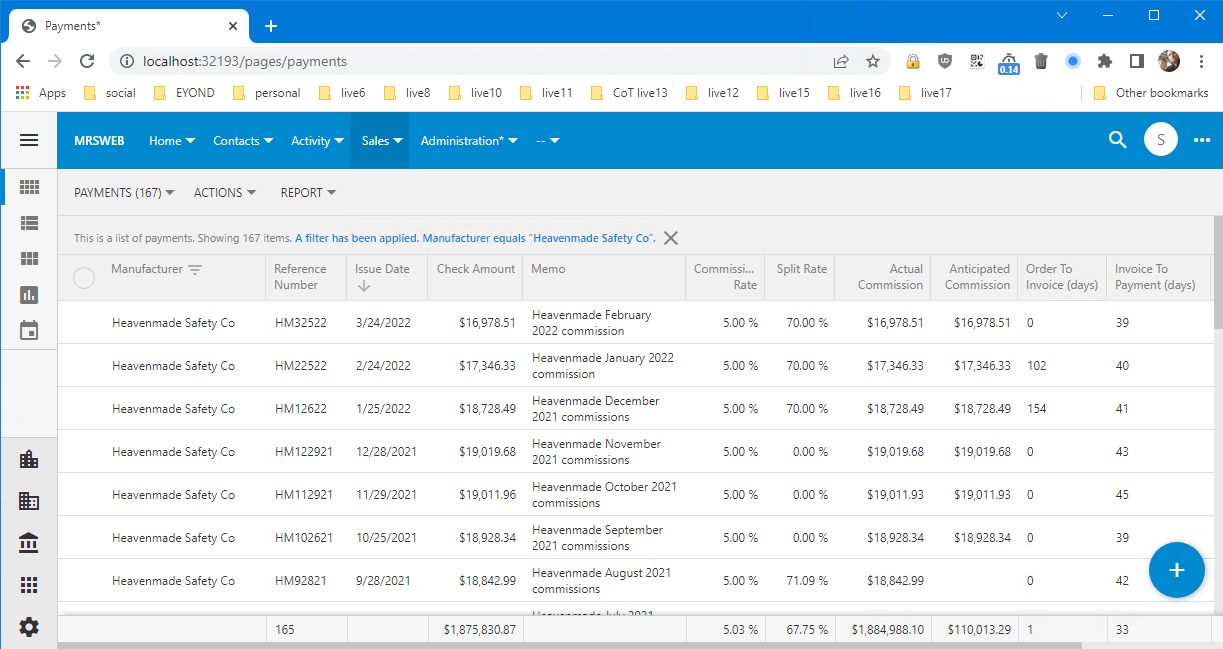
Every Data Analysis view centers around 5 core financial metrics:
| Metric Column | Description |
|---|---|
| 1. Sales Dollars | Total invoiced dollar volume. |
| 2. Cost Dollars | Cost of goods or factory baseline cost. |
| 3. Gross Margin | Net margin dollar spread (Sales - Cost). |
| 4. Commission Dollars | Total gross commission earned by the agency. |
| 5. Commission Rate % | Effective commission yield percentage (Commission / Sales). |
Customer Ranking & Ship-To Analysis
Run Top 20 Customer Ranking views by Principal, Product Line, or Territory. Utilize Ship-To analysis to track where products are physically delivered versus billed.
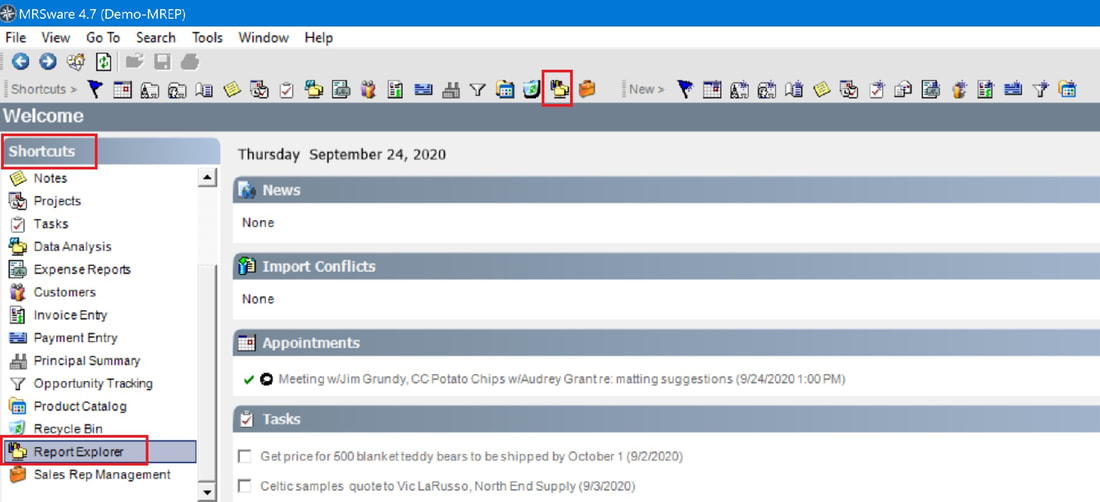
Report Explorer & Saved Views
Generate standard financial statements, Class Master Lists, and Rep Commission Statements. Save custom Data Analysis pivot layouts for one-click re-opening.