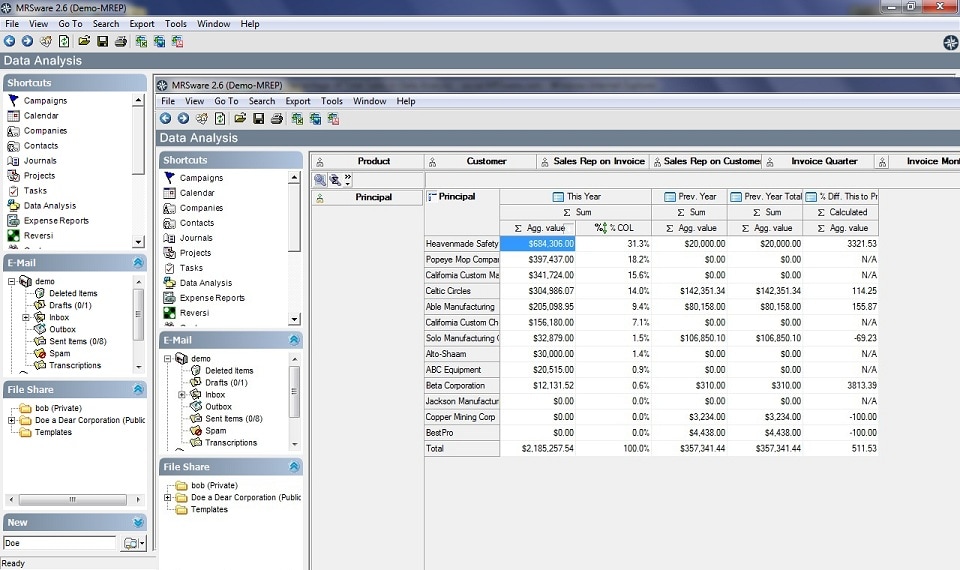
You can see what each Principal represents, percentage wise, of your total sales last year by going to Data Analysis.
2 - Click on Sales Summary Analysis
3 - In the Parameters dialog, enter the appropriate date in the "From Date" field (for example, 1/1/2009)
4 - In the Parameters dialog, enter the appropriate date in the "To Date" field (for example, 12/31/2009)
5 - Click "Ok"
6 - Drag the "Customer" dimension to the top of the table and release it next to the last dimension on the same bar
7 - Drag the "Product" dimension to the top of the table and release it next to the "Customer" dimension
8 - Click on Summary Settings (the second gray icon above Principal - if you place your cursor over the icon it will say Summary Settings)
9 - Uncheck the boxes - "This month, This Month Prev. Year, % Diff. This to Prev. Year Month"
10 - Click "Ok"
11 - Right click the "Sum" cell in the This Year column and click on "% COL"
12 - Double click the "Agg value" cell in the This Year column to view your Principals top down (this is optional but I think it's clearer who your largest lines are by sales.
Once this is done you can click on "Export" on the Menu bar and choose any method you wish to print the report or e-mail it to someone else.
You can also repeat the steps in the Sales and Commission Analysis cube if you want to see what percentage of your total commissions each Principal or manufacturer represents.
* If you don't use the calendar year for accounting purposes, just enter the dates of your calendar year instead of the examples I used in steps 3 and 4.


 RSS Feed